somewhere to talk about random ideas and projects like everyone else

stuff

#polar

Visualizing Facebook Activity 29 May 2012

You might have noticed that I haven’t written much for this blog in the past few months. In truth, it’s because of school work, which has never really been something of an issue before. This is, quite probably the least productive stretch of time in my life thus far. I have a suspicion that this issue stems more psychologically than due to some radical increase in work load, but I haven’t looked in to testing that hypothesis (I’ve been collecting data hour-by-hour about what I’ve been doing in the past two years, so I could probably look into it if I were actually interested in that matter). But school’s nearing a close, and hopefully I can get back to a more productive lifestyle, maintaining my blog and most importantly, trying out cool things. I have a few things which I am working on at the moment which should be completed in the coming weeks (though I make no assurances). But since I have an internal goal for writing one blog post per month, I’m going to recycle a project from December of 2011.

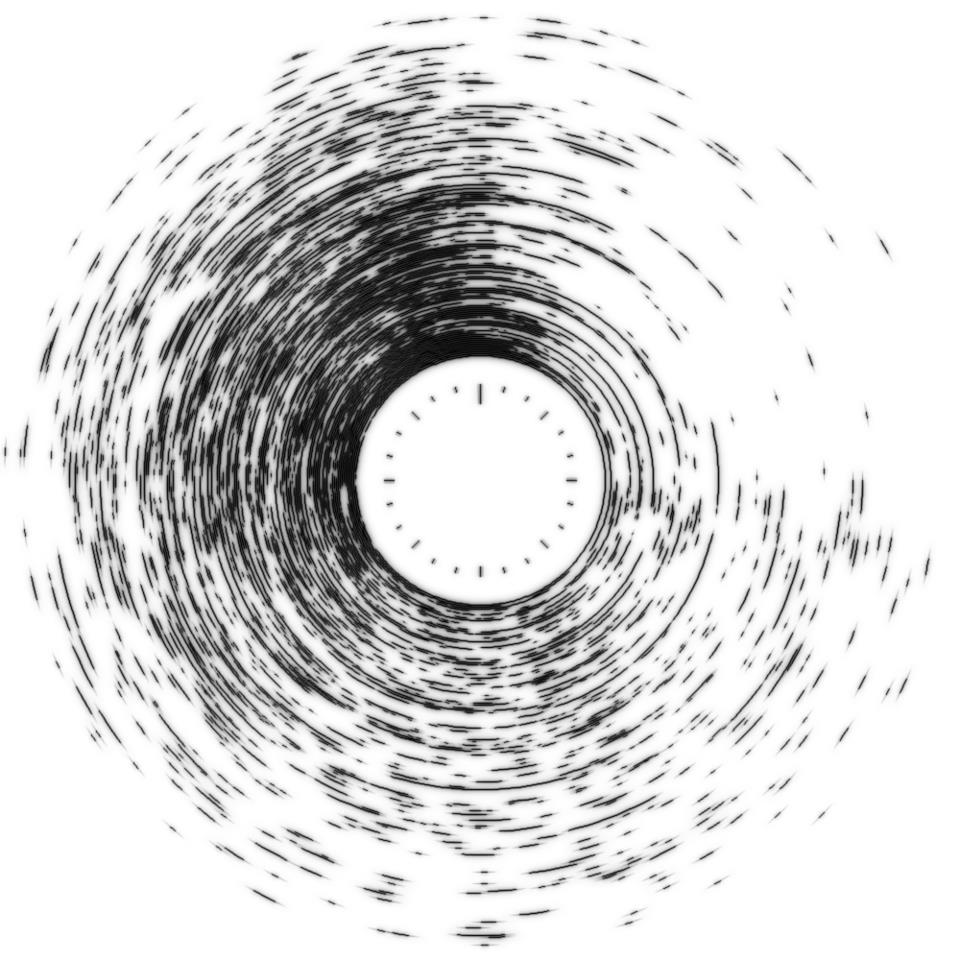
Nearly every day, I inevitably end up glancing at my Facebook “buddy list” of sorts, wondering how many people are online. It’s a figure which almost always seems to depend on the time of day, and behaves almost like clockwork, there’s always a massive swarm of people online around 10-11pm, and hardly anyone is ever online at 4 in the morning. I guess the problem with drawing any conclusions from this in particular is how specific a group this graphic represents. It constitutes my friends, and in particular, my Facebook friends. Essentially all of them are people I’ve encountered in real life, and may or may not actually find interest in. But the thing that unites just about everyone is that they’re generally high school aged.

Before going on discussing how pretty of a chart this is, I think it’s worth going through what this chart actually represents. It’s quite easy to tell that this is in fact a polar chart, and on the inner circle, you can tell that it’s a 24 hour clock. Each of the rings represents a friend, and the rings are sorted by the total amount of time spent on Facebook in the given period. So you can see that toward the middle, the graph is almost opaque at every time, whereas on the fringes, the online activity is quite erratic and infrequent.

So, where does this data come from? It’s actually quite simple to get from the Facebook API. I have a cron job which runs every minute to run a FQL request and save the results to a specific log file.

The actual FQL which runs in order to retrieve the list of online users is

SELECT uid, name, online_presence FROM user WHERE online_presence IN (‘active’, ‘idle’) AND uid IN (SELECT uid2 FROM friend WHERE uid1 = me())

Basically, get the User ID, the name, and their online presence state for friends who are either active or idle in the list of the logged-in user. Since Facebook is an OAuth2-type API, you need an access token in order to do anything cool. I just use the Facebook Graph API Explorer to generate my access tokens. Just go press “Get Access Token”, and select (at minimum) the permissions “user_online_presence”, “friends_online_presence” and “offline_access”. Then copy and paste the revealed token into some authkey.txt and you should be set.

I have a python script to go through the log file and to render it as the polar chart which is depicted on the top of the page. The code used for that is frankly atrocious and the output is even more so. Python Imaging Library is used, which is a lovely library, except not for drawing graphics. There isn’t any smoothing or anti-aliasing on the arcs drawn by PIL and they all look hideous. So I render the chart at some absurdly high resolution and down-resize it in GIMP while adding layering, blurs and opacity in order to make the picture somewhat less atrocious. Also, it does’t support restricting the app to drawing a specific day of the week, even though it might be interesting to see the how the trend differs on a weekday versus weekend.

Something interesting about the appearance of the polar graph is that it almost resembles something of a digital fingerprint, and that brings up some interesting privacy considerations. Inside that graphic are the Facebook browsing habits of some two hundred people. There’s the question of how much this changes day by day for users, and to what extent this can be used to identify people. And even if a single ring doesn’t unambiguously represent a single person, the two hundred or so rings of their friends probably goes pretty far into identifying people. There’s also a striking amount of uniformity that says a lot about the type of people who I tend to associate with. Just at a glance, one can tell that there are very few people I’m friends with on Facebook who live in different timezones. Maybe what’s more dangerous than being able to identify a person is to be able to identify what kind of groups that person belongs to. And over the course of a day, just about everyone checks Facebook a few times.


MusicAlpha v2.0 29 March 2012

MusicAlpha works again, and this wasn’t some minor update that fixed a small hole, the entire app has been rewritten. There’s a new user interface which has really quite beautiful animated polar progress bars, but the most significant part is that the mystical protobufs-over-https protocol has been decoded and documented.

It really started on January 30th, when Simon Weber contacted me for information on the upload process because his Unofficial-Google-Music-API received various user requests to implement uploading. I remembered a message sent a little while earlier offering help decoding the protobufs and tried out the method described, which involved using a disassembler to patch the curl_easy_setopt method to disable checking of SSL certificates. This turned out to be the trick and I used Fiddler to collect a few dumps of data for subsequent analysis. That was really quite a magical moment because everything afterwards was relatively straightforward. The huge stumbling block which had prohibited progress for these past months had been lifted and the task which was left, of reverse engineering the protocol, seemed eminently viable. With only minor hiccups over the next few days, I built a python prototype of the program. I created a .proto file which was somewhat human readable with field names based on guesses.We realized some pretty cool things or at least got a much better understanding of how Google Music seems to work (This blog post was started in the early part of February, but I’m finishing this up halfway through March).

For instance, the reason Music Manager doesn’t work on virtual machines is because they use the computer’s MAC address as a system for identifying individual devices. They have a cap on the number of devices which can be authorized to manage your music, which is currently set to 10. This caused a bit of confusion when I hit that device cap while testing (At one point I assumed that the MAC-esque field was actually a random string, so after fifteen or so tests everything started silently failing). However, it occurs to me that it isn’t particularly interesting to read the narrative of how exactly the current version of the application has come to exist. The technical overview of how the actual protocol works can be found on the google-music-protocol project page on Github. It includes a brief overview of the mechanism as well as sections which detail the specific messages which are sent to the server and also includes a simple reference implementation. Hopefully it should be enough information for anyone who is actually interested in doing something which relates to it (though I am curious if anyone could possibly create something interesting out of it, please contact me if you decide to do anything at all with it). So at this point, I’d like to skip over to the actual application-specific aspect: MusicAlpha itself. This is the story of how the rewrite came to be, and the rather lengthy time it took to to write this blog post describing it.

One of the first things I realized was that the entire application would essentially need to be rewritten. The code dealt primarily with altering the attributes of a song by mimicking the web client’s interface, something which wouldn’t be very useful now that all the metadata is sent via the magical protobufs scheme. Since that code gets scrapped, I figured why not scrap the rest. I wrote the first version while experimenting with darker color schemes and obscenely prominent border radii and gradients. I’m not sure that I can say it’s objectively better, but it does look a bit more interesting, especially that big two-ringed polar chart.

There’s some text to the right side, but it’s not particularly of interest. There’s a big file selection button, but that’s pretty uninteresting. Embroidered on the solid gray backdrop is the logo, a simple and unchanged music symbol- unchanged from the last version. I used, for the first time, custom web typography. Just some fancy looking sans-serif fonts I picked from Google’s Font Library. On the old application, I had two progress bars to show the upload progress, one is for individual songs and the other is the overall progress. I wanted to portray upload progress in a manner which was somewhat smoother and more aesthetically alluring than a mere linear bar.

In trying to create that better progress bar, I created a polar progress bar in canvas. All updates are smoothly interpolated and watching the bars spin around and invert is somewhat reminiscent to staring at an old record spin on a turntable, something which I’ve only seen a few times in my (rather short, at this moment) life, but magical enough to still inspire a sense of nostalgia.

Central to making an aesthetically appealing polar chart is making the animation smooth. This might be doable through various esoteric CSS transforms, but I’m not particularly knowledgeable in that area, and I’m not a huge fan of crafting elaborate animations with CSS. It lacks a certain amount of control (which manually updating and redrawing affords) and tends to feel extremely sluggish on computers which lack extremely modern graphics cards (such as mine). Since things like uploading a file involves a lot of guesswork and various aspects of the upload process are very much stochastic (ie. waiting for the server to respond), the smoothing system needs to be able to create a nice smooth animation out of highly erratic information. But it also needs to simultaneously relay information without having an excessive amount of lag.

In order to strike a sort of balance, it uses an interpolation algorithm which was employed in Steve Wittens’ js1k entry and you can see my code here. In order to minimize the CPU tax of running such an animation, it uses the HTML5 requestAnimationFrame function. This has the nice side effect that when you leave it uploading in the background for a while, it automatically stops updating the animation and quickly slides into position when you return.

There are two rings, the outer one being dark gray and the inner one being a somewhat lighter shade of gray (fitting into the mostly unsaturated theme of the interface). The outer ring represents the total upload progress while the inner ring represents the progress of an individual file. The outer ring “spins” in a sense, in a clockwise manner while the inner ring rotates in the opposite direction. Every time a ring completes a revolution, it “inverts”, for instance, when the outer ring fills up and becomes a solid circle, the ring begins to open from the opposite direction so that the imaginary end of the rotation continues unimpeded. The animation is somewhat difficult to describe in words so here’s a demo of the progress animation.

When the page first loads, the polar plot exists in the background, behind the prominent logo. It represents the song quota, the percentage out of the 20,000 song quota which Google Music imposes.

While implementing the algorithm, I had a little trouble because of SSL certificates. The domain which accepts all the protobufs encoded information has a certificate signed for the wrong domain, and browsers have a tendency to care a lot about certificate validity. To get around it, those requests are proxied by a simple server which is made with Google App Engine. All communication with that server itself is signed as well, and it doesn’t do any logging.

When I was about to publish this post and first announced that it works again, there was a bit of trouble which people had getting it to work. This was actually because Google Music allows each MAC address to be associated with a few accounts but forbids any additional accounts. The first released version would use a single mac address for all clients, but it has since been replaced with a sort of unique identifier which is stored in localStorage.

Apparently a browser based uploader may be something coming soon to Google Music. Enjoy this app while it lasts.