somewhere to talk about random ideas and projects like everyone else

stuff

#python

Methods and Functions 16 December 2015

I watched a recording of Rob Pike’s talk Simplicity is Complicated a few weeks ago, and I was struck by his sentiment that many popular languages seem to be converging by adding popular features from other languages.

In particular, it seems that many popular languages combine aspects of object-oriented and functional programming— support for classes, high-order functions, and reduction. Sometimes this leads to situations where the distinction between methods and functions are confusing or inconsistent.

In Javascript, you find the length of an array or string using a getter method "blah".length but in Python[^2], it’s done through a function invocation len("blah").

This dichotomy is more evident when operations get chained in sequence to process some stream of data. Here’s an example in Java 8 of the object-oriented approach where methods are chained[^1]:

double average = roster.stream()
    .filter(p -> p.getGender() == Person.Sex.MALE)
    .mapToInt(Person::getAge)
    .average()

An alternative way to write the code is by thinking about it as function composition— as you can do in Haskell:

(sum (map sqrt (filter (>3) [1,2,3,4,5,6,7])))

An interesting exercise is to pay attention how your eyes move as you scan through snippets of code to figure out what it does.

To do that, let’s abstract away the slightly different syntax for these different languages and imagine a hypothetical language where x.y.z is syntactic sugar for z(y(x)). That is, when a function name is suffixed after a . behind some expression, it is equivalent to wrapping the entire expression and using it as the first argument.

More concretely, 32.double is equivalent to double(32), and 49.divide(7) is equivalent to divide(49, 7).

For a more complex example:

range(0, 20).map(x: sqrt(x)).filter(x: x > 3).sort.sum

sum(sort(filter(map(range(0, 20), x: sqrt(x)), x: x > 3)))

With the first code snippet, the process can be read left-to-right, and you can imagine it as the story of a little chunk of data flowing through the system.

With the second code snippet, you instead read the function from the inside-out. To a certain extent, it’s right-to-left, but you have to check the other side to make sure you aren’t forgetting any extra arguments.

Let’s try to visualize this:

sum(sort(filter(map(range(0, 20), x: sqrt(x)), x: x > 3)))
                    ------------
                ----            ------------
         -------                             ----------
    ----                                               -
---                                                      -

You can see here that interpreting the behavior with the functional style[^3] begins in the middle and approaches the beginning right-to-left. But when you reach some new function name, you have to zig-zag to the opposite side to visually inspect whether or not the method has any additional arguments.

range(0, 20).map(x: sqrt(x)).filter(x: x > 3).sort.sum
------------
            ----------------
                            -----------------
                                             -----
                                                  ----

The method chaining approach (read: OOP style) is nice because it fits the conceptual model of data flowing through a sequence of transformations, and it doesn’t disrupt the typical western left-to-right reading order.

To me, this seems much easier both to read and to write (for I am not so blessed as to use Paredit and must carefully tread a vast sea of syntax to manually close my parens) and I’ve always been mildly infuriated trying to learn Haskell[^4] because function composition feels much less natural[^5].

One of the stated reasons for why Python uses len is that you can’t glance at the type of the expression by looking at its head. When you’re scanning through a line and you see that the outermost function is “len”, you can immediately tell that the output is a number. When length is determined in postfix, you can’t determine the final type of an expression until you look at the end of the expression.

Another problem is that this linearized sequential syntax only helps when the the structure of an expression is relatively linear. Imagine instead that you have an expression like

sum(range(floor(sqrt(multiply(3, 4))), divide(square(5), 2)))
                     --------------           
                -----              -          ---------
          ------                    -  -------         ----
    ------                           --                    -
----                                                        -

In this case, both multiply(3, 4) and square(5) are of relatively similar depth which gives it the humps making it look like a snake eating an elephant.

Flattening it with the . syntax then forces range into a little invisible spot in the middle and that makes it a lot harder to interpret the behavior of the program.

3.multiply(4).sqrt.floor.range(5.square.divide(2)).sum

In fact this dot stuff is beginning to look a lot like the postfix notation in stack-based programming languages like FORTH) (read: similarly unreadable).

That actually leads to the nifty realization that it’s kind of like tail call optimization for the human mind.

When reading some code composed of nested function application, you end up having to keep track of how many level within the function you are. There’s an idea in psychology that human working memory can contain up to 7 ± 2 items. So reading some deeply nested set of expressions is naturally difficult.

But if the expression tree naturally represents a sequence of actions transforming a piece of data— you can reorganize it in such a way that depth of your mental stack doesn’t keep growing and objects can be substituted in place.


Passing objects as the first argument isn’t really all that strange. The way classes are implemented in python, methods are just functions with an implicit self argument.

class Dog:
    def talk(self, text):
        print "woof!", text, "bark!"

shibe = Dog()
shibe.talk("wow! such speak!")

So with the code above, shibe.talk("wow! such speak!") is really just shorthand for Dog.talk(shibe, "wow! such speak!").

Neither is it particularly strange to access method properties through function calls. This seems to be quite typical for accessing fields of typeclasses in Haskell.

data Car = Car {
    company :: String, 
    model :: String, 
    year :: Int
}
let WusTangClan = Car {company="Ford", model="Wustang", year=1967}
model(WusTangClan) -- "Wustang"

[^3]: Note that while I’m characterizing this as the functional style, many functional languages such as F# have a “pipe-forward” operator “|>” which has a similar effect. Haskell seems to have a convention where the data is passed as the last argument rather than the first argument, which makes implementing this particular strategy a bit clumsy.

[^2]: In the Python FAQ Guido describes the rationale behind the “len” function as opposed to using a method on strings and lists. Interestingly more recent revisions of the FAQ make it sound as if it were some mistake rendered unfixable by history.

[^1]: Something analogous to this sort of chained-method style is also used in popular frameworks like d3 and jQuery.

[^4]: Well, there’s also that incident where I tried installing some Hello World example with Cabal and ended up, through a far more infuriating series of events, rendering my Macbook unbootable.

[^5]: In similar vein, I’d like there to be a “@\” in Mathemath so that I can do data \@ transformation 1 rather than the other way around with the existing “/@” operator


Outlook Offline Address Book Parser in Python 30 July 2014

Look! It's a snake! To be precise, it's a Boa photostolenfromnationalgeographae constrictor.

Oh Lord, I’m so sorry.

I once heard a story about a magnificent exhibit at the 1964 World’s Fair— there was a great monument to the synergy of mind, hand, and electromechanical accomplishment— a fully functional 40 foot steel typewriter.

Children and adults alike would carefully crawl up the giant black injection-molded keys until they reached their favorite letter, at which point they started jumping furiously to activate the spring-loaded key.

When it finally gave way, they’d sit down and marvel at the thunderous spirit they had awakened. There was a magnificent whiffle tree mechanism which spun a solid metal typeball with such heft that you couldn’t help but imagine whether the Earth itself was the type element of God’s cosmic typewriter— his tool for imprinting the ribbon of time with the ink of fate.

They called it an I-beam Selectric.


Sometimes you hear a story which involves the confluence of so many strange coincidences, you’re almost certain that it’s all build-up for some colossal letdown of a punchline.

That’s what the title— “Microsoft Outlook Offline Address Book (OAB) Format Parser in Python” should probably evoke— and if that wasn’t enough, the photo of a BOA Constrictor on the thumbnail should certainly put it over the edge.

I don’t expect anyone in the world to find a legitimate use of something like this, but I feel obligated to write a blog post anyway. So I’ll write it about the vague subject of bad puns— because I happened to name an OAB parser written in a certain snake-related language an anagram of the format which shares a name with a particular snake-related snake.


Meta Analytics 17 August 2012

I’ve been maintaining this blog, or at least the content inside it for about five years now. It’s been through a handful of incarnations, often paired with significant changes in web hosting. I’ve had a blog for a little bit longer, but I don’t think I have the medium figured out. The structure of the posts and the style has changed over the past few years, but I can’t at this point call it evolution, a positive progression. Part of the power which lies in analyzing data is the ability to realize patterns, often at a different scale from human observation (spans of months or years) which are equally if not more insightful.

That’s been my personal attraction to data science. I’ve had a couple of personal experiments involving collecting data about my daily activities, my old writing and code in hopes of distilling the changes that I’m too conceited to admit without the infallible hand of statistics. For nearly two years now, I’ve logged my entire life within precision of approximately 30 minutes from Google Calendar (or the Calendar app on iPad which syncs to Google Calendar). Actually, the label is slightly off, I quite often dedicate large spans of time to more or less useless labels like “not productive”. But this temporal information falls apart in terms of its richness, for my schedule is dictated more so by the mandatory rhythms of school life than the drifting cadence of other behavior.

But I digress. This isn’t about why I collect data so much as “I have this data, now what?”. In this case, I had a hypothesis, a rather simple albeit morbid one at that “my blog is dying”. It’s not hard to see how I’m coming at the conclusion. I’m pretty much struggling at this point to meet my goal of one post per month (itself not a particularly difficult goal, but as time has gone on and my posts have become more infrequent, I feel more compelled to write obscenely long posts to compensate, but of course this also leads to big posts sitting there unfinished for long durations losing the sort of one post = one sitting mentality). But before I ramble for too long, I’ll cut to the chase and answer the question posed at the beginning of this paragraph: “Graphs.” (you could imagine those haunting glyphs levitating in the midst of air caught in the invisible grasp of Giorgio A. Tsoukalos, or better yet, I can spare your cognitive abilities by making it real)

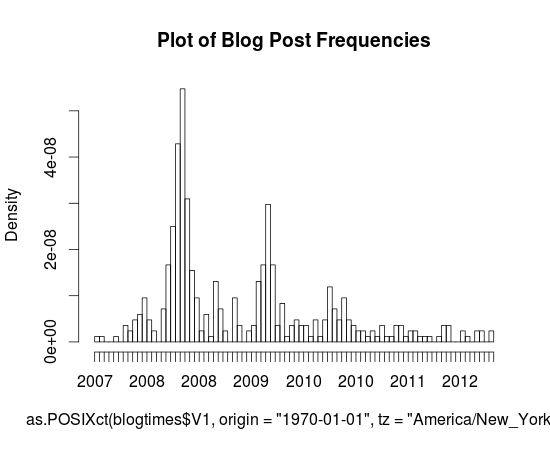
Here’s a pretty little graph I made in R (sorry for the mess on the horizontal axis, and I just realized I have no idea as to how to interpret the dates, I’m assuming that they’re linear and it’s just some odd aliasing issue that makes even-numbered years repeat twice), it’s a histogram of the dates of posts that I’ve made to this blog (extracted with a simple Python script and Wordpress’s built-in Export button).You can probably actually tell that the blog’s demise is quite a long way’s coming. Every annual peak ends up shallower the following year and the first time gaps have actually existed was this fateful year, 2012.

It’s actually sort of interesting that these peaks exist, but I can’t really tell during what months that happened during (since these axes are labeled so terribly, it’d be nice if I knew some nice interactive graph engine that worked with histograms, something like that cool time series viewer that Google had for Finance for like ever but for histograms, but I guess that just shows how much of a non-scientist I am, to have no idea how to fluently articulate in a statistical or graphical language of my choice).

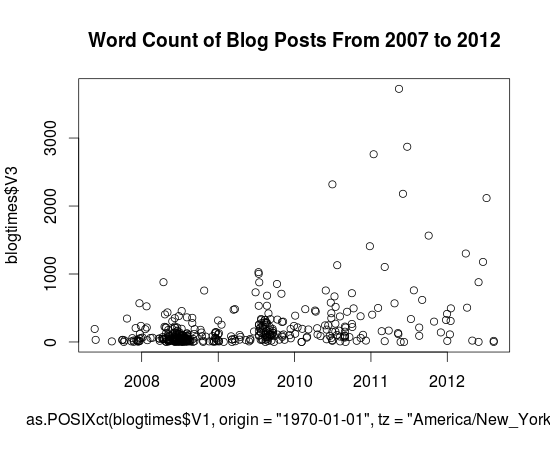
For more graph fun, here’s a scatter plot of word lengths as a function of year. I wasn’t dedicated enough to figure out how to get NLTK to tell me the Gunning-Fog, Flesch-Kincaid or ARI value for individual posts, and I doubt that would end up showing anything particularly insightful. But yeah, so here it is. Charts. Charts of words. Note that thing that sticks out clocking in at around 3724 words is my first Music Alpha post.

Actually, I won’t mind that Wordpress isn’t yet self aware (‘ello Skynet) and still sends trackbacks and pings (whatever they are) to me when I link to myself. Seriously, you don’t actually need to have a self-aware artificial intelligence in order to learn how to not spam me with emails when I’m quite probably as in super definitely aware of its existence. But anyway, I guess I’ll stomach the lurching pain of a thousand emails (I’m using hyperbole here, in case your rudimentary artificial intelligence algorithms can’t quite distinguish them, but I’m also pretty sure your algorithms wouldn’t be able to handle n-th degrees of meta, so this excruciatingly useless parenthetical wouldn’t be much other than that: excruciatingly useless) and post the last part of the list here.

1340133957.0 , 2012-06-19 19:25:57 , 1178 [http://antimatter15.com/wp/2012/06/pinball/](http://antimatter15.com/wp/2012/06/pinball/)

1333025085.0 , 2012-03-29 12:44:45 , 1302 [http://antimatter15.com/wp/2012/03/musicalpha-v2-0/](http://antimatter15.com/wp/2012/03/musicalpha-v2-0/)

1293394934.0 , 2010-12-26 20:22:14 , 1409 [http://antimatter15.com/wp/2010/12/drag2up-v2-drag-and-drop-uploading-for-all-sites/](http://antimatter15.com/wp/2010/12/drag2up-v2-drag-and-drop-uploading-for-all-sites/)

1317686582.0 , 2011-10-04 00:03:02 , 1565 [Haven't actually published this yet, hmm]

1341591648.0 , 2012-07-06 16:20:48 , 2117 [http://antimatter15.com/wp/2012/07/cloudfall-a-text-editor/](http://antimatter15.com/wp/2012/07/cloudfall-a-text-editor/)

1307064165.0 , 2011-06-03 01:22:45 , 2180 [http://antimatter15.com/wp/2011/06/why-the-chrome-web-store-is-bad-for-the-web/](http://antimatter15.com/wp/2011/06/why-the-chrome-web-store-is-bad-for-the-web/)

1277922545.0 , 2010-06-30 18:29:05 , 2319 [http://antimatter15.com/wp/2010/06/wave-embed-api/](http://antimatter15.com/wp/2010/06/wave-embed-api/)

1294958307.0 , 2011-01-13 22:38:27 , 2762 [http://antimatter15.com/wp/2011/01/the-ambiguity-of-open-and-vp8-vs-h-264/](http://antimatter15.com/wp/2011/01/the-ambiguity-of-open-and-vp8-vs-h-264/)

1308832860.0 , 2011-06-23 12:41:00 , 2872 [http://antimatter15.com/wp/2011/06/samsung-series-5-chromebook/](http://antimatter15.com/wp/2011/06/samsung-series-5-chromebook/)

1305426252.0 , 2011-05-15 02:24:12 , 3724 [http://antimatter15.com/wp/2011/05/uploading-mp3s-to-google-music-beta-from-linux-chrome-os-win-and-mac/](http://antimatter15.com/wp/2011/05/uploading-mp3s-to-google-music-beta-from-linux-chrome-os-win-and-mac/)

That list was compiled by the command cat blogtimes.csv | sort -t',' -k3n | tail, and that’s quite an accomplishment because I had to look up the arguments for the sort command in order to figure that out. Of course, blogtimes.csv is the output of my magical six line python script (which uses BeautifulSoup to extract all the wp:post_dates).

So, with 10 blog posts in that list, every single 8 of them happened after 2011 and 3 of them happened in 2012. Considering that there were 10 things published in 2012 (according to my dataset) and 21 in 2011, that’s a rather significant fraction of the stuff which has been written recently to be insanely long.

Wordpress tells me this post is now at 948 words, so I guess I’ll add a bit of concluding at the end to push it over the magical power-of-ten barrier, so presumably you should brace for the terrible boom which occurs at this point (oh, what’s that? I think that’s my imaginary telephone operator who informs me when I make a factual error, apparently those kinds of booms only happen with waves, and apparently words flowing through word count orders of magnitude don’t count).

The original title of this post was “Meta Analytics & Upcoming Changes”, but in the spirit of the upcoming changes, I’ve moved the “Upcoming Changes” part into its own post (tentatively titled “Upcoming Changes”). You can probably at this point guess that “Upcoming Changes” involves something to tackle the excessive verbosity and to mitigate the absurdly infrequent posts. This probably doesn’t sound nearly as heroic to you as it does to me, because I’m listening to The Avengers soundtrack right now, and “A Promise” is pretty dramatic.


Visualizing Facebook Activity 29 May 2012

You might have noticed that I haven’t written much for this blog in the past few months. In truth, it’s because of school work, which has never really been something of an issue before. This is, quite probably the least productive stretch of time in my life thus far. I have a suspicion that this issue stems more psychologically than due to some radical increase in work load, but I haven’t looked in to testing that hypothesis (I’ve been collecting data hour-by-hour about what I’ve been doing in the past two years, so I could probably look into it if I were actually interested in that matter). But school’s nearing a close, and hopefully I can get back to a more productive lifestyle, maintaining my blog and most importantly, trying out cool things. I have a few things which I am working on at the moment which should be completed in the coming weeks (though I make no assurances). But since I have an internal goal for writing one blog post per month, I’m going to recycle a project from December of 2011.

Nearly every day, I inevitably end up glancing at my Facebook “buddy list” of sorts, wondering how many people are online. It’s a figure which almost always seems to depend on the time of day, and behaves almost like clockwork, there’s always a massive swarm of people online around 10-11pm, and hardly anyone is ever online at 4 in the morning. I guess the problem with drawing any conclusions from this in particular is how specific a group this graphic represents. It constitutes my friends, and in particular, my Facebook friends. Essentially all of them are people I’ve encountered in real life, and may or may not actually find interest in. But the thing that unites just about everyone is that they’re generally high school aged.

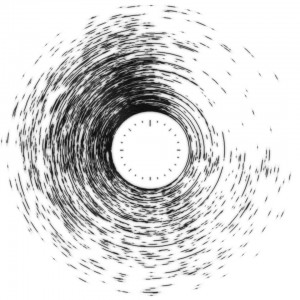
Before going on discussing how pretty of a chart this is, I think it’s worth going through what this chart actually represents. It’s quite easy to tell that this is in fact a polar chart, and on the inner circle, you can tell that it’s a 24 hour clock. Each of the rings represents a friend, and the rings are sorted by the total amount of time spent on Facebook in the given period. So you can see that toward the middle, the graph is almost opaque at every time, whereas on the fringes, the online activity is quite erratic and infrequent.

So, where does this data come from? It’s actually quite simple to get from the Facebook API. I have a cron job which runs every minute to run a FQL request and save the results to a specific log file.

The actual FQL which runs in order to retrieve the list of online users is

SELECT uid, name, online_presence FROM user WHERE online_presence IN (‘active’, ‘idle’) AND uid IN (SELECT uid2 FROM friend WHERE uid1 = me())

Basically, get the User ID, the name, and their online presence state for friends who are either active or idle in the list of the logged-in user. Since Facebook is an OAuth2-type API, you need an access token in order to do anything cool. I just use the Facebook Graph API Explorer to generate my access tokens. Just go press “Get Access Token”, and select (at minimum) the permissions “user_online_presence”, “friends_online_presence” and “offline_access”. Then copy and paste the revealed token into some authkey.txt and you should be set.

I have a python script to go through the log file and to render it as the polar chart which is depicted on the top of the page. The code used for that is frankly atrocious and the output is even more so. Python Imaging Library is used, which is a lovely library, except not for drawing graphics. There isn’t any smoothing or anti-aliasing on the arcs drawn by PIL and they all look hideous. So I render the chart at some absurdly high resolution and down-resize it in GIMP while adding layering, blurs and opacity in order to make the picture somewhat less atrocious. Also, it does’t support restricting the app to drawing a specific day of the week, even though it might be interesting to see the how the trend differs on a weekday versus weekend.

Something interesting about the appearance of the polar graph is that it almost resembles something of a digital fingerprint, and that brings up some interesting privacy considerations. Inside that graphic are the Facebook browsing habits of some two hundred people. There’s the question of how much this changes day by day for users, and to what extent this can be used to identify people. And even if a single ring doesn’t unambiguously represent a single person, the two hundred or so rings of their friends probably goes pretty far into identifying people. There’s also a striking amount of uniformity that says a lot about the type of people who I tend to associate with. Just at a glance, one can tell that there are very few people I’m friends with on Facebook who live in different timezones. Maybe what’s more dangerous than being able to identify a person is to be able to identify what kind of groups that person belongs to. And over the course of a day, just about everyone checks Facebook a few times.


ShinyTouch/OpenCV 15 July 2010

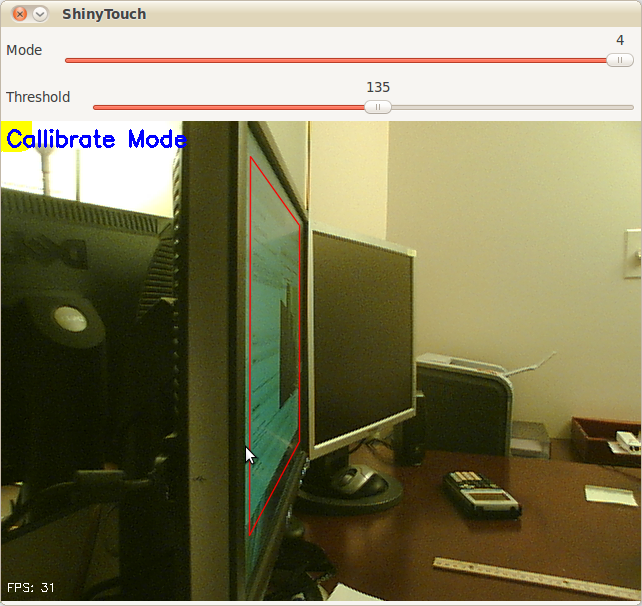
I have yet to give up entirely on ShinyTouch, my experiment into creating a touch screen input system which requires virtually no setup. For people who haven’t read my posts from last year, it works because magically things look shinier when you look at it from an angle. And so if you mount a camera at an angle (It doesn’t need to be as extreme as the screenshot above), you end up seeing a reflection on the surface of the screen (this could be aided by a transparent layer of acrylic or by having a glossy display, but as you can see, mine are matte, but they still work). The other pretty obvious idea of ShinyTouch, is that on a reflective surface, especially observed from a non-direct angle, you can see that the distance from the reflection (I guess my eighth grade science teacher would say the “virtual image”) to the apparent finger, or “real image” is twice the distance from either to the surface of the display. In other words, the reflection gets closer to you when you get closer to the mirror. A webcam usually gives a two-dimensional bitmap of data (and one non-spatial dimension of time). This gives (after a perspective transform) the X and Y positions of the finger. But an important aspect of a touchscreen and what this technology is also capable of, a “zero-touch screen”, is a Z axis: the distance of the finger and the screen. A touchscreen has a binary Z-axis: touch or no touch. Since you can measure the distance between the apparent real finger and it’s reflection, you can get the Z-axis. That’s how ShinyTouch works.

Last year someone was interested and actually contributed some code. Eventually we both agreed that my code was crap so he decided to rewrite it, this time using less PIL and pixel manipulation, and instead, opting for more OpenCV so it’s faster. The project died a bit early this year, and with nothing more to do, I decided to revive it. His code had some neat features:

  • Better perspective performs
  • Faster
  • Less Buggy
  • Simpler configuration (track bars instead of key combinations and editing JSON files)
  • Yellow square to indicate which corner to click when callibrating (actually, I wrote that feature) It was left however, at a pretty unfinished state. It couldn’t do anything more than generate config files through a nice UI and doing a perspective transform on the raw video feed. So in the last few days, I added a few more features.

  • Convert perspective-transformed code into grayscale

  • Apply a 6x6 gaussian blur filter
  • Apply a binary threshold filter
  • Copy it over to PIL and shrink the canvas by 75% for performance reasons
  • Hack a Python flood-fill function to do blob detection (because I couldn’t compile any python bindings for the opencv blob library)
  • Filter those blobs (sort of) Basically, it means ShinyTouch can now do multi-touch. Though the Z-axis processing, which is really what the project is all about still sucks. Like it sucks a lot. But when it does work (on a rare occasion), you get multitouch (yay). If TUIO gets ported (again), it’ll probably be able to interface with all the neat TUIO based apps.

Code here: http://github.com/antimatter15/shinytouch/ Please help, you probably don’t want to try it (yet).


Real Wave Desktop Reader 29 October 2009

Very exciting, I know.

Some people have probably heard of WaveBoard, the application for iPhone and OS X that claims to be a desktop client for wave. However, it’s really just a webkit browser that has some extra triggers for some better desktop integration. But it’s still not a real Wave client. Obviously cause doing so would be insanely hard and since the Client/Server protocol isn’t released, has to be reverse engineered.

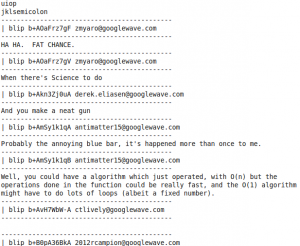
So I reverse engineered part of Wave that allows an entire wave to be downloaded and parsed into blips with tree structure.

I’m careful to title this a Wave desktop reader because it only does reading and in the crudest of forms.

http://static-bot.appspot.com/view/?id=googlewave.com!w+Ze3l0mj0A the state of Google Wave does seem to have changed, so this post, from June 30th 2010 at 6:43am (which is what Wordpress says, but I have a hard time believing as I usually am not up that early. But obviously this commentary is from much after, after the great wave-announcement of the end of the year) Anyway, static-bot (which later became wavereader and then anonybot) has deceased in the most horrific way, and while the original Wave is still accessible, it probably won’t be for long (by the time I have my next eruption of nostalgia in a few months), Wave may have already died. So It’s probably best to paste information that was there into this post

For the Google Wave Client/Server protocol documentation, scroll down. For documentation which relates to stuff other than loading a wave (eg, search, playback, etc) See “Google Wave Protocol Documentation”

I spent a bit of time with firebug trying to reverse engineer some parts of Wave’s complex inner workings. I’ve made a offline wave reader using this amazing technology.

This is way different from Waveboard which is an embedded Webkit for a mac application which has some extra bindings for somewhat better desktop integration. It is not a real desktop client (technically, neither is this, but this is closer). This one is based on a reverse engineered part of the Wave client-server protocol (which hasn’t been released, hence reverse engineering).

But first, to make clear the limitations:

  • Does not contain a web renderer so no images, embeds, gadgets, etc
  • Does not maintain an active connection for real time updates
  • Can not submit updates (no OT)
  • Can not list waves
  • Can not create waves

So what can it do? It can read a wave, and create a raw text backup. While not terribly exciting, it’s still progress. It is usually quite a bit faster than Wave at loading things.

**Download (Read Usage below):

** http://dl.getdropbox.com/u/1024307/pywavereader/login.py

 http://dl.getdropbox.com/u/1024307/pywavereader/read.py

**Usage:

** Yay, the fun part. This isn’t very user friendly, so be warned. Unless you’ve used the command line before, it may be insanely scary.

  1. Download the files.
  2. Extract it somewhere
  3. Go to that directory from the command line
  4. Run python login.py USERNAME PASSWORD (Feel free to check the source if you’re afraid its gonna steal your credentials)
  5. Watch as some awesome info piles down and state.txt is generated
  6. Run python read.py WAVEID
  7. This part is weirdish. Since bash (for me) throws random errors and all the waves you can see are on googlewave.com!w+ anyway, a shorter wave ID can be used which lacks the part before the + sign. For example, this wave’s short ID is Ze3l0mj0A
  8. Watch as the wave’s contents are populated onto the command line notably without order (may be fixed eventually, probably not).

Future:

I’m trying to find out how the Wave searches are done and that might be next, soon a mostly usable read-only wave client may be possible. It would be great if people could help in this process.

Licensed under GPLv3 and made in Python (Yeah, commandline ftw). The code is pretty crappy, I’m not especially good at Python but at least it’s cross platform. Probably someone could hook it up to a web server to give access to public Wave content to the general public. Maybe this will spark some future wave desktop client.

And obviously, some time in september, Google will decide to shut down Wave because it was super experimental and rendered this all useless and one day on the cold not snowy monday afternoon of december twenty seventh the year 2010 though the relative epoch really isnt that important, so you could also say that it’s year 40 if you use the unix epoch. And obviously this was not in the initial post.


ShinyTouch/JS 28 August 2009

Yay for yet another demo that strives to mix an mash almost everything HTML5 related! ShinyTouch in JS dumps the stuff from a <video> tag with ogg encoded video (well, almost all video from linux is ogg encoded so it’s just whatever format i got first from cheese). It gets dumped into <canvas> and getImageData does it’s magic.

Interestingly, if you don’t use the video and just do data from a raw image, you get upwards of 125fps on V8. Adding the video, it ceases to work on Chromium (maybe a linux thing? this tells me it’s just linux, but you can never be so sure).

//At this point, run away as the algorithm gets messy and hackish

So the thing just searches from right to left up to down within the quad. When it finds a column of something that fits the rgb range of the finger that is larger than a certain threshold, it checks for a reflection from the point. If it detects a reflection then yay! it throws the data at the perspective warper (based on a python one which is based on a C# one and though it would probably be easier to port from C# to JS making long chains of derivative work is fun). If there wasnt a reflection then it logs that and if that number is larger than some othe rthreshold then it kills the scanning and goes on with it’s life. The reflection algorithm just takes the point 5 pixels to the right and assumes that would be a reflection if there was one and a point 15px above and 5px to the left (nasty stuff) and takes the hue value from their RGB values. It takes the absolute value of the difference of the hue values multiplied by 100 (or 200 in the python version) and compares it with a preset configuration variable.

So now that that horrible algorithm which was just whatever came to my little totally untrained mind first. But it works semi-decently, at least for me. But you can hopefully see how nasty it’s inner workings are and it inspires people to clean it up. It’s quite a bit more readable than the Python version and only 200 lines of JS so it won’t be too hard to understand.

But since HTML5 has no Video capture thing for webcams, and my webcam doesn’t work with flash so I can’t use that canvas<-flash webcam bridge i built, uh, almost 2 years ago. So now you just get to gaze at my finger moving for like 20 seconds!

http://antimatter15.com/misc/shiny/shinytouch.html


JS vs Python 27 August 2009

I sorta expected it due to the new V8, Tracemonkey, Nitro, and SquirrelFish engines. But I’m thinking of making a port of ShinyTouch to JS and I was looking into what differences it might end up as.

I have to say I’m really quite suprised. It’s a simple piece of code:

setTimeout(function(){
    var start = (new Date).getTime();
    var n = 0;
    for(var i = 0; i &lt; 10000000; i++){
        n += i;
    }
    var end = (new Date).getTime();
    alert(end-start);
},5000)

Just doing a loop a huge number of times and adding some numbers. But the unscientific results are quite amazing:

Python: 2640, 2110, 2000, 2190

Firefox 3.0 Spidermonkey: 777, 672, 685, 665

Firefox 3.5 TraceMonkey: 659, 365, 629, 629

Chromium Nightly: 146, 150, 147, 152

While these only test basic arithmetic and recursion, The browser is 15 times faster than Python, it just feels quite incredable.


ShinyTouch Images 01 August 2009

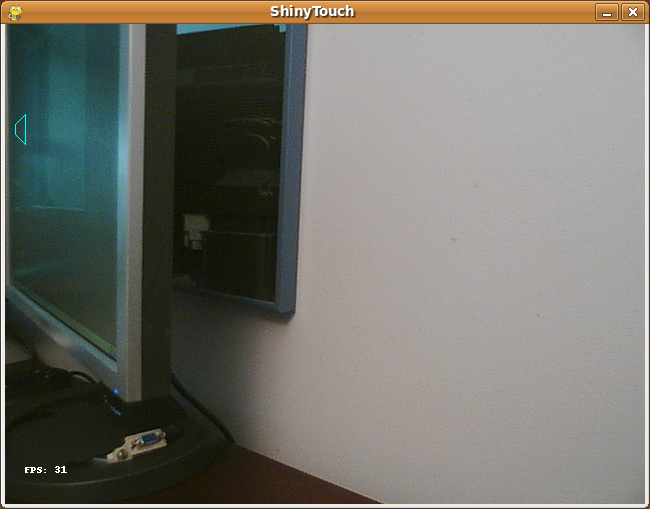
This is the app running, notice that it’s not yet been calibrated yet.

Here is the auto-calibration process, it alternates between black and white

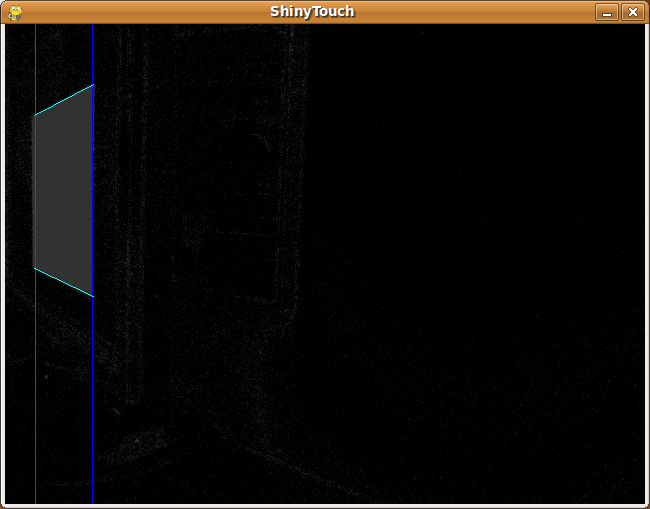
This is part of Auto-Calibration.

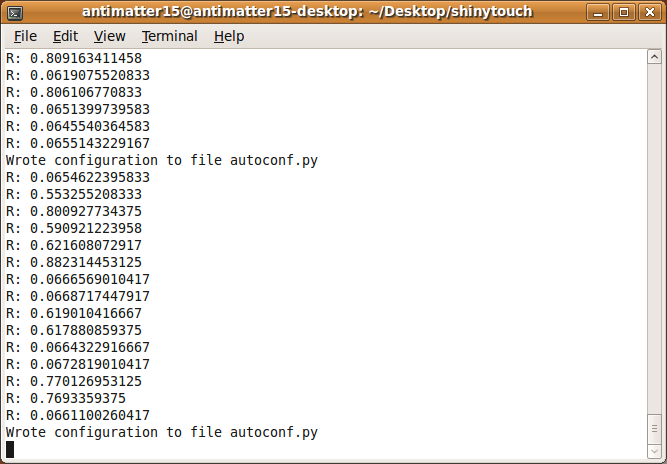
This is some stuff from the command line:

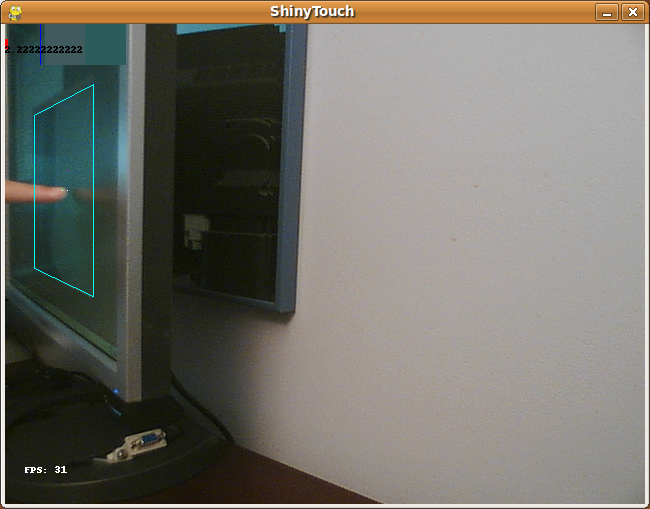
This is just hovering over the screen, notice it’s not touching, and the algorithm can distinctly recognize the lack of a touch because the reflection is seperated from the finger by a significant gap. (Compare the top red bar).

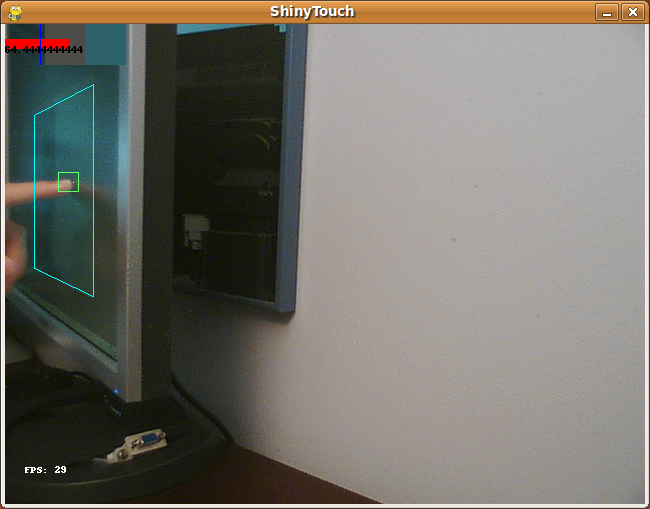
This is a actual touch, you can see that the red bar is far larger, and it’s very distinctly a touch event.

There’s a draw tool and, here is a primitive drawing of a smiley. The dots come from an issue with PIL/OpenCV or something that makes the image all chopped up and sends the point to an arbitary point on the screen.

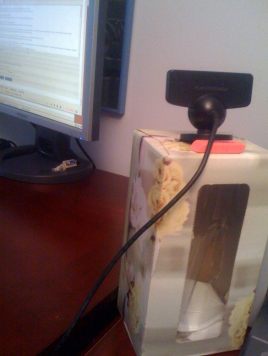
This is the magical sensor the whole thing is powered by: An unmodified Playstation 3 Eye on a tissue box with a pink Office Depot eraser on the back (because the camera is made tilted and the script can’t handle those tilts very well)

It’s not too insanely slow either. This is 31 frames per second coming from a pure python app, all from a scripting language. It is nowhere as fast as the normal fast native apps.


Private Tracker Registration Checker in Python 31 July 2009

Well, I wanted a demonoid account for no apparent reason. So I wanted to search for private trackers, and found this app called Tracker Checker 2 It’s great and all, but it doesn’t work well on linux. Or at least for me, I run it and it pops up a window for a few milliseconds and then closes. There’s nothing in the tray but the process looks like it’s still running. So I looked at the trackers.xml file and thought it would be easy to create another one.

So I quickly hacked together a python script that parsed the xml file and checked for trackers. For some reason, Demonoid said it was open while it was actually closed, so I made a little extension to the format.

I’m actually probably not gonna use this, but I’ve made this private tracker registration checker app in python. It uses a trackers.xml file that is compatable with the Tracker Checker 2 app. It supports a slight extension to the protocol by being able to check if a certain phrase is not in a page. It’s multithreaded and uses expat for xml parsing and urllib2 to download the pages.

I think it would be pretty cool to integrate it with XMPP and port it to Google App Engine, and send out alerts to people when trackers are open.

It has no UI, it’s just a little command line app that could be used as a cron job and integrated with XMPP.

Download here


ShinyTouch Auto-Calibration 25 July 2009

A few days ago I started working on auto calibration for shinytouch. Someone worked it a bit brfire and gave some PyGTK code that did fullscreen correctly but I ended up getting too confused (especially with embedding the video and images and threading delays). So now I started from scratch (or moreover continuing with using pygame) and now it is inherently not full screen. The auto calibration works by setting the contents of he window to be one color and taking a snapshot. After that the color is changes again and the snapshot is once again recorded. After gathering a pair, the software compares them pixel by pixel. It takes multiple trials and takes the average.

Then there is a function that makes cool stuff happen. It goes right to left to search for massive groups of consecutively marked hot pixel change areas. Ir searches for a general trapezoidal shape. And takes the lenghs and heights and positions. And right now, typing on my iPhone I wish the spell corrector was as awesome as the google wave contextual system. So in the near future, shinytouch will be as simple as launchingthe app and hitting a calibrate button and the computer does the rest. Maybe it might ask you to touch the screen in a special magic box or click on your finger afterwards but overall, zero setup and almost no calibration. So on another note, shinytouch is now almost a month old idea-wise. In my idea book, the references to it date back to June 28, though it may have originated a few days prior. For shinytouch the beginning window is quite a bit more broad. Anywhere from last year to march. I seem to recall late January experimentation with mirrors. So now, With shinytouch being the more promising (more acessible and radical) I have stalled development on mirrortouch. It’s quite annoying how fast time passes. There is so much that I really want to do but there is nost not enough time.


Python Ports! 12 April 2009

I’m porting the multitouch concept to python. Why? Because i’m on linux now, mono sucks, and PIL is pretty awesome.

I’ve set up a mock-rig where there are 2 mirrors on the side angled by erasers with a crappy Creative NX webcam mounted on a textbook over it. It seems like the only practical use of this is for a multitouch-table sort because gravity makes it otherwise pretty hard to calibrate.

So after I rewrite the software I need to try getting it to parse an actual image. Then I need to somehow hook it up to streaming webcam data, and somehow do something else.