somewhere to talk about random ideas and projects like everyone else

stuff

#wikipedia

This site is going down tomorrow in protest of SOPA/PIPA 17 January 2012

Not that anyone is going to particularly miss my blog (most of my other web pages will still be up because I’m far too lazy to go through all of them in order to make a slightly less futile protest). But this is one of the most interesting internetwide events that I’ve ever encountered, and I should be shamed to not take part in it. Copyright and its ongoing war with libertarian and anarchist mentalities has fascinated me ever since squinting through Free Culture on my iPhone more than five year ago. Going to Jonathan Zittrain’s Free Culture X keynote a few years ago was fun too.

I’m sure most would feel uncomfortable with my characterization of this as some cyberlibertarian movement, but I think it’s an entirely excusable position for someone living through a period of adolescence characterized by rebellion and Ayn Rand. It’s certainly not the only perspective, but it seems the most poignant and consistent, not that consistency is necessarily a goal of any legislative body. Legislative bodies are meant, to borrow from programming jargon, to monkey-patch a framework that ill-approximates the societal expectation of government.

Now excuse me while I contrive a metaphor that relates to something that I don’t know much about and will seem cringe-worthy to anyone knowledgeable in the subject. Lets say that the Earth is the shape of what the ideal government is. Not ideal in a sense that it’s perfect and elegant, but in the sense that it is empirically derived through the scientific process of experiment. But in large part, this mass conforms to a very general principle (maximizing individual freedoms). I would characterize this is approximating the earth as a sphere. For nearly all applications, this rather crude geometric model works astonishingly well, leading some to even believe that this is what the world actually is. That everything else, the obsession with finding imperfection is actually a delusion and everything comes from measurement error (well, that’s when this metaphor breaks down because nobody actually does this). Legislators shape the body of law to conform with the needs of society by poking and adding ridges to where the overlay is incongruous. They do the passive activity of fixing the model, the geoid, to incredible precision. But there’s a more radical way, molding the earth into what our model was. We can forget about the lapses, and soon enough the surface of hte earth will erode down into that perfect sphere of ideology.

There. I think I’ve fulfilled my obligation to write some words with some ostensible meaning with regard to something that pertains rather dearly to my life. If this passes and we descend into a dystopian nightmare reminiscent of 1984, at least I’ll have something to look back on. An old man filled with regret waiting to die alone. Or at least without an internet. I did my best (but still far from enough, as is anything besides martyrdom) to preserve crowd immunity to hazardous legislation, but alas we were stricken.


Offline Wiki Redux 30 December 2011

There’s just something incredibly alluring about the concept of holding the sum of human knowledge with you at all times. While near-ubiquitous connectivity alleviates this to a certain extent, the momentary lapses of networking are incredibly corrosive to an information dependent mentality. Wikipedia never ceases to amaze me and, while I’ve tried in the past to encapsulate part of its sheer awesomeness, this marks a much more significant attempt.

The differences start even before the data gets to the application. The preprocessing toolchain was entirely rewritten for a multitude of reasons. First of all, it compresses not the entireity, but rather the most popular subset of the English Wikipedia. Two dumps are distributed at time of writing, the top 1000 articles and the top 300,000 requiring approximately 10MB and 1GB, respectively. While ostensibly, the mere top 300k articles is far too narrow to delve deep into the long tail, the breadth of the meager 1/25th of articles consistently surprises me in its depth. The advantage is that at 1GB, it’s relatively easy to fit into any system. The algorithm which strips extraneous content has been made far more sophisticated than the original series of regular expressions. This enables greater compression and less accidentally omitted content.

On the application end, the application has switched from a GWT-compiled LZMA SDK to a speedy, pure javascript decoder. This makes page loads significantly speedier and allows greater compression ratios, for individual blocks can be made larger (256KB instead of 100KB). It also now uses WebGL Typed Arrays to further speed things up, such as sending data to and from the WebWorker thread.

The interface was redesigned with CSS media queries to dynamically transition between different modes in response to different viewing environments. The interface consists of two regions: the fixed position recessed left panel which holds the page title, a search bar, controls and the page outline. This collapses down to a toolbar header automatically when the screen estate is limited. It uses an Apple-esque noise texture background.

Downloads happen in little units called chunks (they’re half a megabyte for the dump file and about four kilobytes for the index). The local file can be built up out of order. While online, all storage operations check the virtual file, indexed db, or web sql database. If it’s not there, it transparently uses an XMLHttpRequest in order to fulfill the request and caches it to disk in the respective persistence mechanism. A bitset is used to keep track of which chunks are already downloaded and which need to be downloaded.

http://offline-wiki.googlecode.com/git/app.html


Offline Wiki Chrome Webstore App 23 April 2011

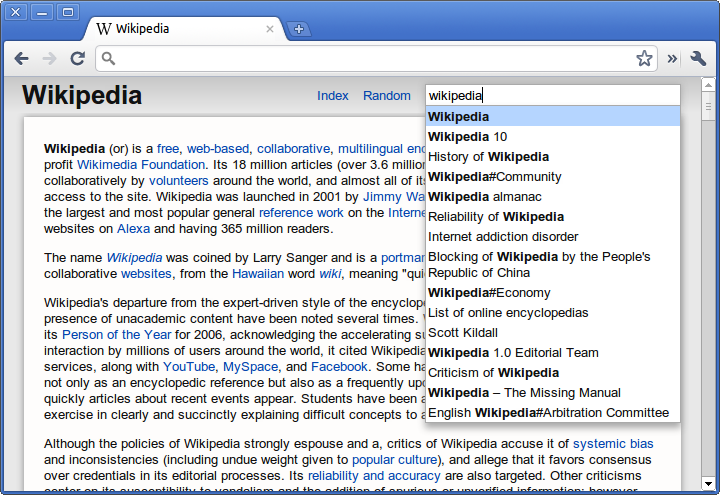
Offline Wiki for Chrome is now on the Web Store. The app that started a few months ago and took forms as Offline Dictionary. The chrome app version is much more refined, aesthetically and functionally. The search bar and autocomplete are much less obtrusive, and there’s gradients and box shadows, a sure indication of progress :)

Description

The most significant difference, is that it includes the entire English Wikipedia, a pretty close approximation of the sum of all human knowledge. Uncompressed, it’s something like 30 gigabytes of raw text, and the compressed version that I’ve compiled for this app clocks in at around 3.7 gigabytes (3.4GB for the actual compressed dump and 0.3 for the search index file). Hosting and serving up all those gigabytes does cost money, so that’s why the app isn’t free. But it’s still a pretty good value considering the equivalent apps for iOS are twice the price.

It includes an index which lists every single article in Wikipedia, paginated and navigable through a scroll bar. There are something like 50,000 pages of the index (the exact number depends on the size of your screen), and articles are divided into columns. There’s a button which sends you to a random article, and a search bar.

However the notion of this app is pretty strange: A webapp which only serves its function when offline. However, the ease of installation and use of this app is somewhat unparalleled on the desktop space. This app allows the browsing of the database instantly after the download has begun, rather than nearly all other such apps which require the entire dump to be downloaded first. There’s no conversion process. Everything pretty much hopefully just works.

HTML5 is awesome.

The interface is done entirely with CSS and HTML, no images except the obligatory xkcd reference. The toolbar is a css3 gradient and enclosed with HTML5 tags like <article>, <header> and <footer>. The download progress is indicated by a native <progress> bar element. The index is navigable through a slider bar created using <input type=range> and all the page titles are put automatically into columns by the css3 column layout properties.

The really cool stuff is what’s in the javascript. Probably the most significant development which has enabled this app is an awesome thing called the FileSystem API which exposes a special persistent sandboxed read/write directory which can be modified through the File API. When the page is first loaded, the process of downloading begins, and it uses the responseType attribute of the XMLHttpRequest to get the downloaded chunk (it just sets the request header to specify a range of one megabyte) as an array buffer. Array Buffers are a part of the WebGL specification which enables the storage and manipulation of binary data. It then uses BlobBuilder to convert that array buffer into Blob which can then be written using the File API to the hard disk.

To search, it reads a small portion of the index file by using a particular slice of the file, which is the equivalent of seeking on a disk. It implements binary search to quickly locate a certain article on the disk and then reads a chunk from the dump in much the same way. Then it uses a javascript implementation of the LZMA compression algorithm to decode a certain hundred-kilobyte block into raw WikiText which is then parsed into HTML.

Finally, the pushState and replaceState methods from the History API are used to handle the navigation of pages without reloading,.

Get it now

Offline Wiki for Chrome


ShinyTouch Progress Update + Fresnel's Equations 12 July 2009

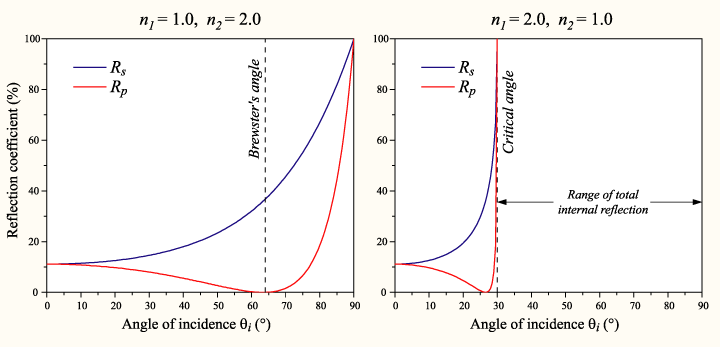
So I was looking through wikipedia to find out if there were some magical equations to govern how it should mix the color of the background screen contents and the reflection and make the application work better. I think Fresnel’s equations fit that description. It basically gives the reflectiveness of the substance from information about the substance, the surrounding substance (air) and the angle of incidence.

Well  this image really is quite intimidating. I wont even pretend to understand it  but it looks like Fresnels equations with different values of n1 and n2 (some ratio for different temperatures). And is the plot on the right the same Total Internal Reflection in FTIR?
A really intimidating image from none other than Wikipedia

It’s quite interesting, partly because the shinyness (and thus the ratios used to combine the background color with the finger to compare) depends on the angle of the webcam to the finger, which depends on the distance (yay for trigonometry?). So the value used isn’t the 50-50 ration that it currently uses in the algorithm universally, but it’s dependent on variables to Fresnel’s Equations and the distance of the finger.

I forgot what this was supposed to describe

Anyway, time for a graphic that doesn’t really explain anything because I lost my train of thought while trying to understand how to use Inkscape!

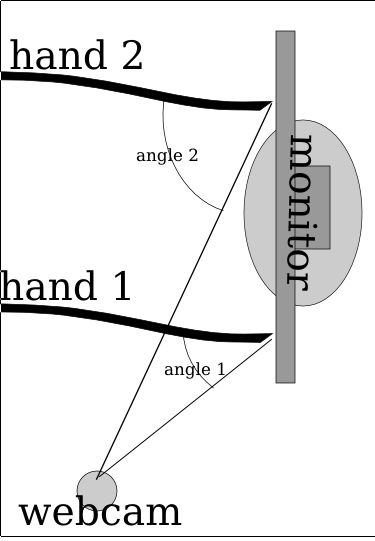
So here’s something more descriptive. The two hands (at least it’s not 3, and why they’re just lines with no fingers isn’t my fault) and they’re positioned at different locations, one (hand 1) is close to the camera while the second (hand 2) is quite far away. Because of magic and trigonometry, the angle of the hand is greater when it’s further away. Also, this plugs into Fresnel’s Equations which mean the surface is shinier for where hand 2 is touching while it’s less shiny for hand 1. So the algorithm has to adjust for the variation (and if this works, then it might not need the complex region specific range values).

Notice how Angle 2 for hand 2 is much larger than angle 1 because of how it
Yay For Trig!

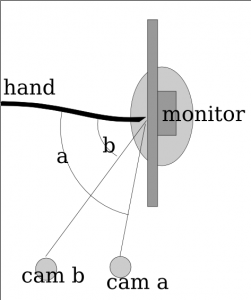
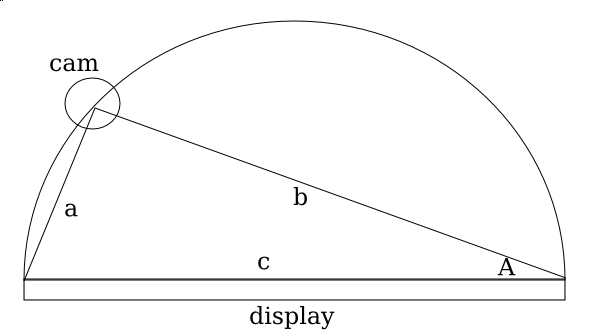
So here it’s pretty ideal to have the angle be pretty extreme right? Those graphs sure seem imply that extreme angles are a good thing. But no, because quite interestingly, the more extreme the angle is, then the less accurate the measures from the x axis become. So in the image below, you can see that cam b is farther from the monitor (and thus has a greater angle from the monitor) and it can discern far more accurately depth than than cam a. The field of view for cam a is squished down to that very thin angle whereas the cam b viewing area is far larger. Imagine if there was a cam c which was mounted directly in front of the monitor, it would suffer from no compression of the x axis like a _or _b but instead it has full possible depth.

the more extreme the angle is  then the lower the resolution of the usable x axis becomes. So while you get better accuracy (shinier = easier to detect) the accuracy point you can reduce it to declines proportionally.
Extreme angles have lower precision

So for the math portion, interestingly, the plot for the decline in % of the total possible width is equivalent to the 1-sin() (I think, but if I’m wrong then it could be cos() and i suck at math anyway).

So since it
More Trig!

So if you graph out 1-sin(n) then you get a curve where it starts at 100% when the angle the camera is positioned at is 0 degrees from an imaginary line perpendicular to the center of the surface, and it approaches 0% as the degree measure reaches 90 deg.

So interestingly when you plot it, basically what happens is a trade-off between the angle the camera is at and the precision (% of ideal maximum horizontal resolution) and accuracy (shinyness of reflection). I had the same theory a few days ago, even before I discovered Fresnel’s Equations, though mine was more linear. I thought that it was just a point in which the values dropped for the shinyness. I thought that the reason the monitor was shinier from the side is that it was beyond the intended viewing angle, so since there is less light at the direction, the innate shinyness is more potent.

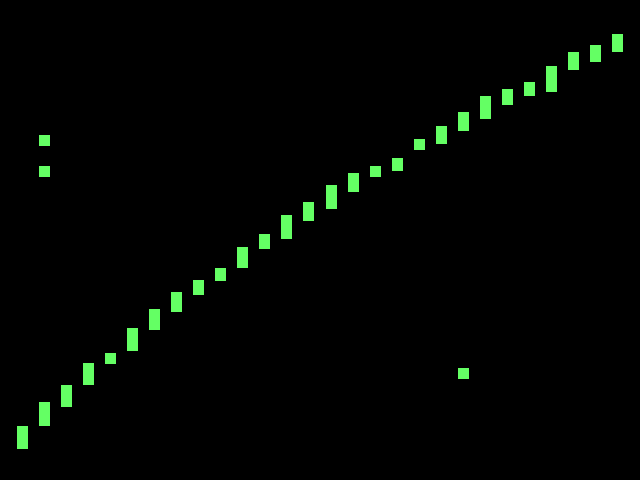
So what does this mean for the project? Well, it confirms my initial thoughts that this is far too complicated for me to do alone, and makes me quite sad (partly because of the post titled Fail that was published in january). It’s really far too complicated for me. Right now the algorithm I use is very approximate (and noticably so). The formula improperly adjusts for perception and so if you try to draw a straight line across the monitor, you end up with a curved section of a sinusoidal-wave.

Trying to draw a straight line across the screen ends up looking curved because it uses a linear approximate distortion adjustment algorithm. Note that the spaces between the bars is because of the limited horizontal resolution  partly due to the angle  mostly due to hacks for how slow python is.
Issues with algorithm

So it’s far more complicated than I could have imagined at first, and I imagined it as far too complicated for me to venture in this alone. But I’m trying even with this sub-ideal situation. So the rest of the algorithm for now will also remain with more linear approximations. I’m going to experiment in making more linear approximations of the plot of Fresnel’s equations. And hopefully it’ll work this time.


Distributed Computing Take III 31 December 2008

I donno why, but i’m revisiting this. I was trawling across Wikipedia one day, and I got to the article about Pi. I tried distributing Pi a while ago, actually, before I did the hashes. But I never ended up implementing it because it didn’t seem feasable, as all the algorithims I encountered (or tried porting) required lots of memory, something very hard to distribute for this scenario. But this time, I found these. Looking through them, and googling in the process, I found http://www.omegacoder.com/?p=91, and ported it over to Javascript. It was relatively slow compared to the SuperPi implementation in Javascript, but it was easily distributed.

One problem though, is that it gets slower every iteration (to find the net block of digits). Finding .141592653 will be roughly 20ms faster than the next 9 digits (it processes in blocks of 9). Not only would it take longer, but it occupied 100% of the CPU, and it would pop up that ever-annoying “This script may make your computer non responsive” window. So I implemented this pattern to make it not lock up any browser other than Chrome (and possibly WebKit Nightly).

Still, it would take up 100% of the CPU. I ran it overnight and got to digit 17,000.

Eventually, it would take about half an hour for a single iteration (at the 20000th digit). With web-based distributed computing, I can’t rely much more time than what Google Analytics reports to be 00:02:24 (my Average Time on Site). And that’s half an hour with a 3ghz Intel Core 2 Duo (it’s dual core, but the script, is single threaded).

I then split the function into smaller parts. the main function was split up, and the loops were divided across users. Now, it can scale easily. It uses virtually no visible CPU. and fits well into that 2 minute timeframe.

Try it out here, but don’t stay too long, because i only set there to be 500 “jobs”.